Interpretation and Analysis of Graph MCQs in English for UP PET Exam 2025 – 2026. 10 Marks Questions, will be asked in UPSSSC PET Exam. All type Graphs (Pie, Line, Bar) with solved questions practice set.
Directions: 1 to 5: Details of a country’s statistics of a particular year are given below. Read the pie chart and model the answer.
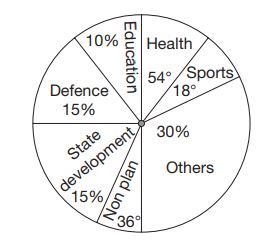
Question 1- If the total amount spent by the Government during the year was Rs 1,00,000 cores, then the amount spent on health and education together was.
A) Rs 25,000 crore
B) Rs 20,000 crore
C) Rs 30,000 crore
D) Rs 15,000 crore
100 % = 360°
100% = $ \dfrac{360}{100}\times10$ = 36 °
Corresponding angle for expenditure on health and education
= 36 + 54 = 90°
360° =Rs 100000 crore
90° = $ \dfrac{100000}{360}\times 90° $
= Rs 25000 crore
Hence, the correct option is (a).
Question 2- If the total amount spent by the Government during the year was Rs 3,00,000 cores, the amount spent on state development exceeds that on sports by?
A) Rs 30, 000 crore
B) Rs 45, 000 crore
C) Rs 35, 000 crore
D) Rs 25, 000 crore
Expenditure on state development =15%
100% = 360°
15% = $ \dfrac{360}{100}$15 = 54°
Expenditure on (state development-sports)
= 54° – 18° = 36°
∴ Required amount
= Rs$ \dfrac{36}{360}\times 30,0000$ crore
= Rs 30,000 crore
Question 3-The percent of less money spent on non-plan than that on defence is.
A) 15 %
B) 5 %
C) 12%
D) none of these
Expenditure on defence
= 15% = 54°
Required percent
= $ \dfrac{54 – 36}{54}\times 100 = \dfrac{100}{3}$%
Hence, none of the given options is correct.
Question-4 The percent of excess money spent on others than that on sports is.
A) 26%
B) 25%
C) none of theses
D) 28%
Amount spent on sports = 18° = 18 × (5/18)% = 5%
Amount spent on others = 30%∴ The percent of excess money spent on others than the on the Sports = 25%
Question 5 : The percent of the total spending that is spent on health is.
A)15%
B) 20%
C) 25%
D) 30%
Expenditure on health = 54°
360° = 100%
54° = $ \dfrac{100}{360}\times 54 = 15$ %
Hence, the correct option is (a).
Directions (6–10): The pie chart shows how the school fund is spent under different heads in a certain school. Using the below pie chart answer the questions.
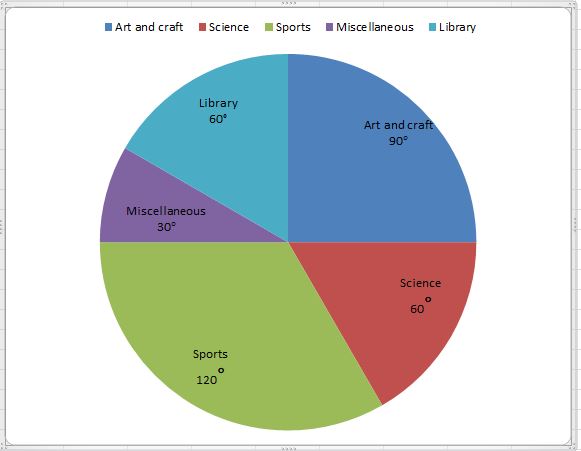
Question 6 : What percentage of the total expense is spent on library?
A) 24.3
B) 24
C) 20
D) 16.6
Corresponding angle of expenditure on library = 60°
Required percent = $ \dfrac{60}{360}\times 100$
= $ \dfrac{50}{3}= 16.67$%
Hence, the correct option is (d).
Question 7 :Which head uses 25% of the funds?
A) Sports
B) Miscellaneous
C) Library
D) Art and Craft
100% = 360°
25% = $ \frac{360}{100}\times25$ = 90°
Question 8 : Which heads have the same amount of expenditure?
A) Library and Science
B) Sports and Science
C) Science and Miscellaneous
D) Miscellaneous and Library
Corresponding angle of expense on library = 60°
Corresponding angle of expense on science = 60°
Question 9 : Which head has the maximum expenditure?
A) Art and Craft
B) Sports
C) Library
D) Science
Corresponding angle of expense on sports = 120°
Question 10 : What is the ratio of expenditure on sports to that on art and craft?
A) 1 : 1
B) 4 : 3
C) 1 : 4
D) 2 : 1
Required ratio = 120° : 90° = 4 : 3
Hence, the correct option is (b)
Directions (11–15): The following pie chart shows the monthly expenditure of a family on food, house rent, clothing, education, and fuel and miscellaneous. Study the pie chart and answer the?

Question 11 : If the expenditure for food is Rs 9000, then the expenditure for education is :
A) Rs 5000
B) Rs 5200
C) Rs 5400
D) Rs 6000
Ans : C) 5400
30 % = Rs 9000
$ 18% = \frac{9000\times 18}{30}$
= Rs 5400
Question 12 : The central angle of the sector for the expenditure on fuel (in degrees) is.
A) 50.4
B) 54
C) 57.6
D) 72
100% = 360°
15% = $ \frac{360}{100}\times 15$ = 54°
Question 13 :If the expenditure on fuel is Rs 3000, then the total expenditure excluding expenditure on house rent and education is.
A) Rs 11600
B) Rs 12000
C) Rs 12400
D) Rs 12500
Percentage expenditure on
house rent + education = 38% = 100 – 38 = 62 %
15 % = Rs 3000
62 % = $ \frac {3000}{15}\times62$
= Rs 12400
Question 14 : If the percentage of expenditure on food is x% of the total percentage of expenditure on clothing, education and fuel, then x equals.
A) 66
B) $ 66\frac{1}{3}$
C) $ 66\frac{2}{3}$
D) 67
solutions : 30 % = x % of (12 + 18 + 15 ) %
30 = $ \dfrac{x\times45}{100}$
x = $ \dfrac{30\times100}{45} =\dfrac{200}{3}$
= $ 66\dfrac{2}{3}$ %
Question 15: Total percentage of expenditure on house rent, clothing and fuel is greater than the percentage of expenditure on food by.
A) 16
B) 17
C) 18
D) 20
Solution :
House rent + clothing + fuel = 20 + 12 + 15 – 47 %
Food = 30 %
Difference = 47 – 30 = 17%
Directions (16–20): The following graph shows production (in thousands) of two types (P and Q) of vehicles by a factory over the years 2019 to 2024. Study the graph and answer the given questions.
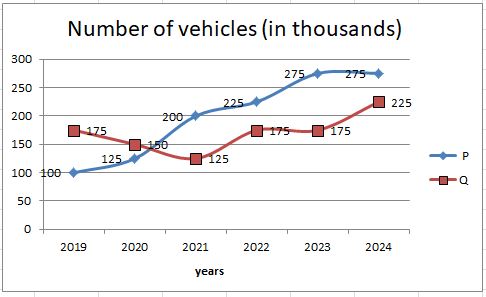
Question 16 : In how many of the given years, was the production of Type P vehicles of the company more than the average production of this type vehicle in the given years ?
A) 3
B) 4
C) 2
D) 5
Average production of type P vehicles
= $ \frac{100 + 125 + 200 + 225 + 275 + 275}{6}$
= $ \frac{1200}{6} =200$thousands
Required years 2022, 2023 and 2024
Question 17 : Approximate percentage decrease in production of Type Q vehicles from 2020 to 2021 is :
A) 10.1
B) 16.7
C) 14.3
D) 12.5
Solution : Required percentage decrease
=$ (\dfrac{150-125}{150})\times$ 100
= $ \dfrac{25}{150}\times100 =\dfrac{50}{3}$
= 16.7 %
Question 18 : The total production of Type P vehicles in the years 2019 and 2021 is what percent of total production of Type Q vehicles in 2020 and 2024
A) 75
B) 69.25
C) 80
D) 81.25
solution: Total production of type P vehicles in 2019 and 2021
= 100 + 200 = 300 thousands
Total production of type Q vehicles in 2020 and 2024
= 150 + 225 = 375 thousands
Required percent
= $ \dfrac{300}{375}\times 100$ = 80 %
Question 19 : The ratio of total production of Type P vehicles to the total production of Type Q vehicles over the years is .
A) 48 : 41
B) 5 : 8
C) 8 ; 5
D) 41 : 48
Total production of Type P vehicles = 1200 thousands
Total production of Type Q vehicles
= 175 + 150 + 125 + 175 + 175 + 225
= 1025
Required ratio
= 1200 : 1025 = 48 : 41
Question 20 :The production of Type Q vehicles in 2020 was approximately what percent of Type P vehicles in 2024?
A) 60
B) 45.5
C) 54.5
D) 75
Required percent
= $ \dfrac {150}{275}\times 100 = 54.5$ %
Directions (21–25): Study the following bar graph and answer the questions.

Question 21 : The number of years, the production of fertilizers was more than average production of the given years is.
A) 4
B) 2
C) 1
D) 3
= ($ \frac {25 + 40 + 60 + 45 + 65 + 50 + 75 + 80}{8}$ )ten thousand tonnes
= $ \frac {440}{8}$ = 55 ten thousand tonnes
Question 22 : The average production of 2016 and 2017 is exactly equal to the average production of the year.
A) 2015 and 2021
B) 2015 and 2019
C) 2019 and 2020
D) 2020 and 2021
Total production in 2016 and 2017 = 40 + 60 = 100 ten thousand tonnes
Total production in 2015 and 2021 = 25 + 75 = 100 ten thousand tonnes
Question 23 :The percentage increase in production of fertilizers in 2022 compared to that in 2015 is .
A) 220%
B) 180%
C) 240%
D) 200%
percentage increase = $ (\frac{80-25}{25})\times$100
= $ \frac{55\times100}{25}$ = 220 %
Question 24 : The percentage increase in production as compared to previous year is maximum in the year.
A)2019
B)2016
C)2017
D)2022
Percentage increase in 2017 = $ \frac{60 – 40}{40}$ $ \times$ 100
= 50%
Percentage increase in 2016 = $ \frac {40-25}{25}\times 100$
= $ \frac{1500}{25}$ = 60%
Question 25 : The percentage decline in the production of fertilizers from 2017 to 2018 is .
A) 26 %
B) 25%
C) 27.5%
D) 23 %
percentage decrease = $ \frac{60-45}{60}\times 100$
$ \frac{1500}{25}$ = 60%
Directions (26–30): The following bar chart shows the sales of a company XYZ (in Rs crore). Study the chart and answer the following questions.

Question 26 : Total sales in 2nd and 3rd years together is.
A) 2688 crore
B) 2888 crore
C) 2788 crore
D) 2488 crore
sales = (1773 + 1115) crore
2888 crore
Question 27 : The second highest sale is in the year.
A) 10
B) 9
C) 8
D) 7
It is obvious from the bar diagram.
Question 28 : The second least sale is in year.
A) 2
B) 3
C) 6
D) 4
Clear from the graph.
Question 29 :The mean of the highest and the lowest sale (in Rs crore) is.
A) Rs 4922.5
B) Rs 4827
C) Rs 4365
D) Rs 4922
average = $ \frac { 8730 + 924}{2}$
= $ \frac {9654}{2}$
= Rs 4827 crore
Question 30 : The sale in the year 4 is less than the sale in the year 8, by.
A) 3608 Rs
B) 3504 Rs
C) 3127 Rs
D) 3427 Rs
Required difference
= (5345 -1841) crores
= 3504 crore
Graph MCQs in English for UP PET Exam
Directions (31–35): Study the bar chart given below and answer the following questions:
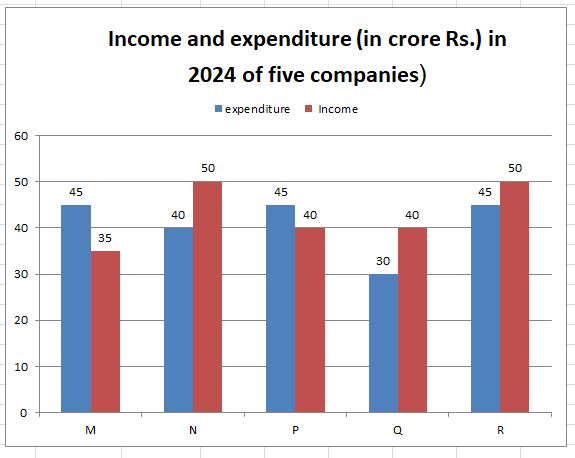
Question 31 :In 2024, the approximate percentage of profit/loss of all the five companies taken together is equal to
A) 6.88 % loss
B) 4.88% profit
C) 6.48 % profit
D) 4 % loss
Total Income = (35 + 50+ 40+ 40 +50) crores Rs
= 215 crores Rs
Total expenditure = (45 +40 + 45 + 30 + 45 ) crores Rs
= 205 crores Rs
Profit percent
= $ \frac{\text{Income-Expenditure}}{\text{Expenditure}}\times$100
= $ \frac{215-205}{205}\times$ 100
= $ \frac{1000}{205}$ = 4.88 %
Question 32 : If the income of company Q in 2024 was 10% more than that in 2023 and the company had earned a profit of 20% in 2023, then its expenditure in 2023 (in crores) was.
A) 34.43
B) 28.28
C) 29.09
D) 30.30
Income of company Q in2023
= $ \frac{100}{110}\times 40 = \frac{400}{11}$ crores Rs
If expenditure in 2000 be Rs x crores,
Profit % = $ \frac{\text{Income-Expenditure}}{\text{Expenditure}}\times$100
= $ \frac{\frac{400}{11}-x}{x}\times$ 100
=$ \frac{20}{100}=\frac{1}{5} =\frac{400 -11x}{11x}$
$ 5\times400 – 55x = 11x$
$ 66x = 2000$
$ x = \frac{2000}{66}$
= Rs 30.30 crores Rs
Question 33 : The company earning the maximum percentage of profit in the year 2024 is.
A) Q
B) M
C) N
D) P
It is obvious from the bar diagram.
Profit percent of company Q
= $ \frac {40-30}{30}\times100$
= $ \frac{100}{3}$ = 33.3 %
Question 34 :The companies M and N together had a percentage of profit/loss of.
A) No loss and no profit
B) 12% loss
C) 10 % loss
D)10 % profit
Total income of companies M and N
= (35 + 50) crores
= 85 crores
Total expenditure
= ( 45 + 40)crores
= 85 crores
Question 35 :For company R, if the expenditure had increased by 20% in the year 2024 from the year 2023 and the company had earned profit of 10% in 2023, the company’s income in 2023 was (Rs in crore)
A) 41.67
B) 35.75
C) 41.25
D) 38.5
Expenditure of company R in 2023
$ \frac {45\times100}{120} = Rs 37.5$ crore
Let the income of company in 2023 be x crores
$ x – 37.5 =\frac{37.5\times10}{100} = 3.75$
x = 37.5 + 3.75
= 41.25 crore Rs
Thanks for attempt Graph MCQs free practice set in English for UP PET Exam.